Quicklinks
DEUTSCH

Step-by-Step

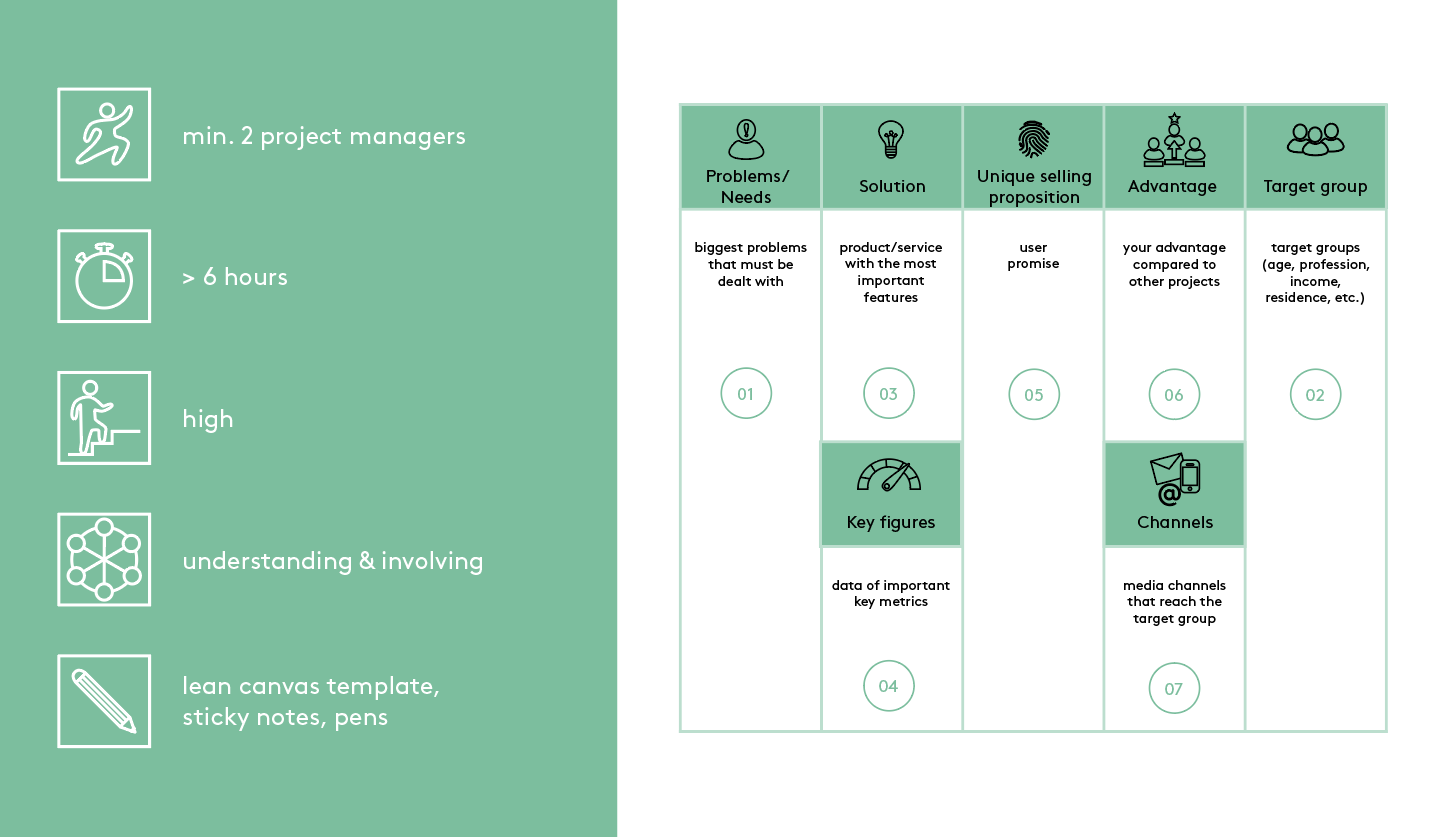
The Lean Canvas contains several fields with different aspects to strategically align your project. The fields listed here should be filled in one after the other. Use data-based information for this.

1. What are the existing and relevant problems or needs in society? Define the biggest problems to be addressed at the beginning.

2. Who is affected by these problems or needs? What target group(s) can you identify (age, income, location, etc.)? You can use the Persona method for a more in-depth discussion of the target group.

3. How can the problems and needs be solved for your target group? Develop a possible solution for each of these problems or needs.

4. How can you measure the success of your solution? Define key metrics of the identified problems or needs that will make your project measurable later, e.g. 30% of people living alone are over 60 years old.

5. What is your unique selling proposition? Define the user promise of your solution offered to your target audience(s).

6. What (competitive) advantage do you have over other projects/providers of similar products or services? Define what is not so easy to imitate in your project, e.g. a large network.

7. What channels can you use to reach your target group(s)? Collect different media for this, e.g. radio, newspaper, Facebook, etc.

8. Afterwards, discuss which conclusions you can draw from the information in the Lean Canvas and which subsequent steps you need to focus on in order to achieve the solutions.

More about the tool

Advantages:

  • The Lean Canvas enables a structured approach to holistically familiarize oneself with the environment and the corresponding context.
  • The Lean Canvas provides a business-oriented view of the overall project and helps to better understand the needs of the target group(s).
  • By drawing conclusions from the collected information, the further course of the project is facilitated, since you already know, for example, how to reach your target group.

Disadvantages:

  • The method is very time consuming because a lot of data needs to be collected.
  • When you collect data, the quality of the results depends on your research methodology.
  • The information and results may change over the course of the project and must be developed and adjusted accordingly in the Lean Canvas.
What are the biggest barriers and challenges to civic engagement? What are the expectations and needs of citizens who are at risk of falling or who support people at risk of falling? With the help of the Lean Canvas method, the sub-project "Fall Management with Civic Engagement" in münster.land.leben has set itself the goal of answering these questions. As part of a student semester project, an evidence-based Lean Canvas model was created for the sub-project. For this purpose, the classic Business Model Canvas was adapted to nonprofit projects by removing the cells "costs" and "revenue", among others. In order to work in an evidence-based manner, both a literature review and a primary data collection among the target group in the form of an online questionnaire were conducted. This involved surveying older people who were identified as potentially at risk of falls and younger people who were identified as potential helpers. The survey focused on the motivation of citizens to accept or offer help, as well as possible inhibiting factors in this area. Based on the results of the survey, the Lean Canvas was completed and important aspects of the users' needs were identified. By using the Lean Canvas, it was possible to gain the insight that there is a general interest in neighborhood assistance from both target groups, nevertheless, there is often a lack of information about an offer or the available time. Initial solutions were then developed for this according the method.
  • Use sticky notes or an online version so you can revise your Lean Canvas as the project progresses.
  • Use different colors for different target groups.
  • Get feedback and opinions from external people.
  • Keep track of two to four pieces of information per cell. Too much information indicates a lack of focus.
  • Use industry-standard metrics, e.g., number of ideas for new products/improved processes, number of program participation, recipient satisfaction rate, etc.

Testimonial


Back to Tools & Methods

Um unsere Webseite für Sie optimal zu gestalten und fortlaufend verbessern zu können, verwenden wir Cookies. Weitere Informationen und die Möglichkeit zum Widerruf finden Sie in unserer Datenschutzerklärung.
Seite drucken